


Creating graphs
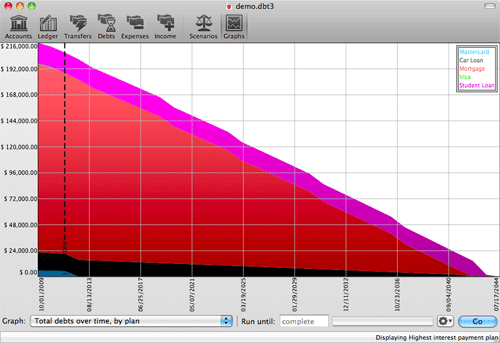
To see things visually, you can create a graph. Four graph options are available
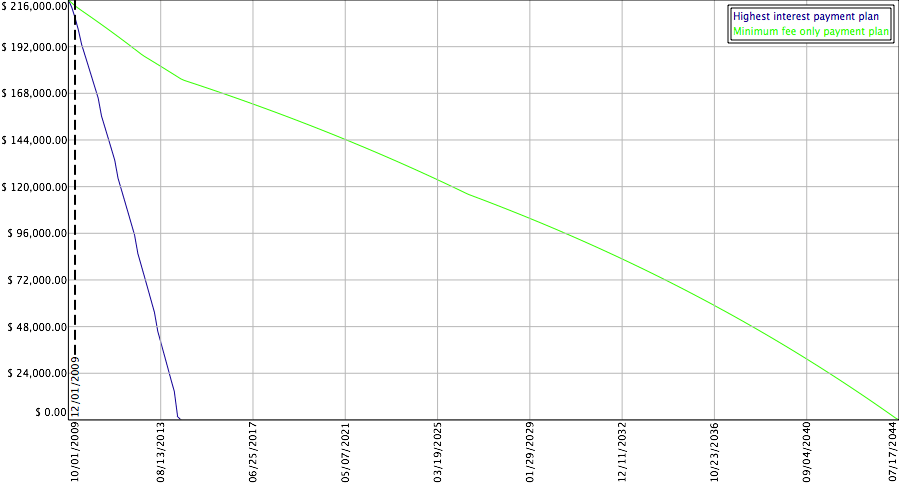
- Total debts over time, by plan
- Total interest paid over time, by plan
- Interest vs. principal, on a plan (this one can only be run on one plan at a time)
- Bank account balance over time, by plan (this one requires that you select the minimum payment plan plus any others to compare against)
You can click on the little gear next to the 'go' button to customize which reports to display. For the total debts or total interest graphs, if you choose to graph only one payment plan, the display will switch to an area graph displaying how much of your total debt each individual account is.
We highly recommend running the interest vs principal graph on the Highest Interest Payment Plan and comparing it against the results you get running it on the Minimum Fee Only Payment Plan. It's quite a comparison. Note how much bigger that red section is? That's a substantial amount of additional money going to interest. The Minimum payment plan is on the left, the Highest Interest plan is on the right.
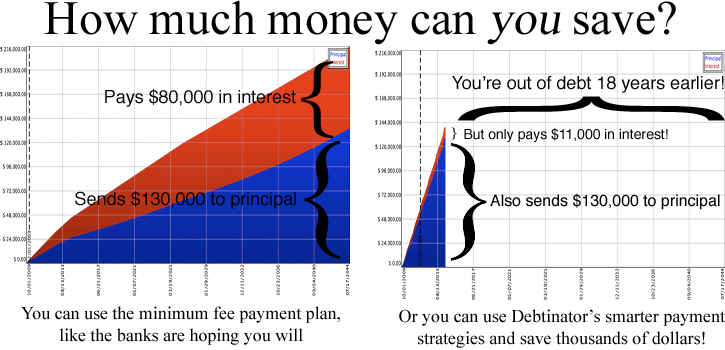
Pay close attention to the fact that you're paying the exact same amount to the principal. Better planning makes a huge difference.
Please note that graphs never use the "payoff out of order if possible" option
To create a graph:
- Click on graphs in the tool bar.
- Select the graph you want to create.
- Optionally hit the gear button to choose which scenarios to run
- Press the 'Go' button.